

With more than 2.5 billion monthly users, YouTube is the world's largest video-sharing platform, offering your brand an unparalleled opportunity to reach its target audience. Millions of new videos are uploaded every day. This means that the competition for viewers’ attention can be intense, raising the need for competitor analysis.
Fortunately, YouTube offers a powerful analytics feature that shows you how your videos are performing and areas of improvement. The feature provides valuable insights into the performance of your videos and overall channel. By reading, understanding, and leveraging this data, you can determine what makes your videos click with viewers and use the data to improve your future videos. In this guide, we will show you how to leverage YouTube analytics to take your channel to the next level.

How to Access YouTube Analytics
If you are a YouTube creator, you can open YouTube Analytics on a desktop or by downloading the dedicated analytics mobile apps. If you are using the desktop version, start by opening the YouTube site in your favorite browser while logged in to your Gmail account, which you will use to manage your channel.
Click your profile picture at the top-right corner. Under the drop-down menu, choose YouTube Studio. If you have multiple channels, tap Switch Account and select the channel you want to analyze. Once you have chosen the channel you wish to view its analytics, click the left-hand panel to manage your channel and content. You can then open the dashboard by clicking on Analytics.
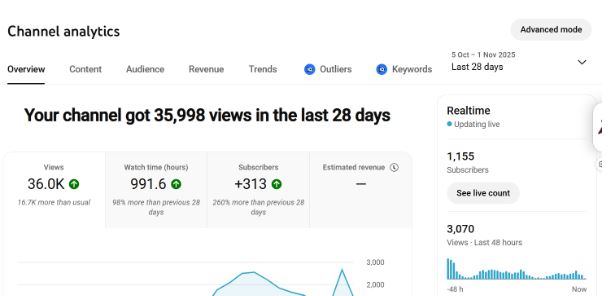
At the far right of the Analytics tab, a toolbar provides access to all your key metrics. To view your performance, switch between the dashboard and other options such as Audience Content and Research. In the far right corner, the date options let you view metrics for a specific period.
You can also analyze your YouTube Metrics in Advanced Mode, located just below the option to select the date, to get a more detailed version of your YouTube analytics. This offers access to features such as:
- Charts export.
- Comparison across your metrics.
- Data exports.
- Deep analysis.
To access this feature on your mobile phone, you will need to download the YouTube Studio app, as it isn't available in the YouTube app.
An Overview of YouTube Analytics
YouTube Analytics provides in-depth insights that help creators enhance their channel performance, refine their content, perform YouTube competitor analysis, and expand their audience. YouTube Analytics is divided into different categories, such as:
General Overview (Channel and Video)
This is a general summary of your channel's or videos' performance. It provides an overview of the channel's reach and impact on engagement. Some of the metrics you will see under the general overview are:
- Real-time performance. It shows the number of interactions and views in your video or channel. It illustrates a general overview of the reception of your video shortly after publication.
- Typical performance. An overview of your historical performance trends compared to the performance of your content. You can then identify audience engagement patterns to adjust your strategy accordingly.
- Key audience retention moment. Under each video, you can see the key moments, including where viewers are highly engaged or dropping off. By understanding the part of the video that captures the most attention, you can optimize your data for better retention.
Content Tab
The Content Tab metric provides a summary of how your audience discovers and engages with content. It can, therefore, help you determine the type of content that resonates with your viewers. To gain insights into a specific video type, filter your data by content type. Some of the metrics you will see in this tab are:
- Impressions.
- Impressions resulting in watch time.
- Top content.
Audience Tab (Video or Channel Level)
This metric will offer insight into the viewers watching your content. This data is available at the video or channel level, providing users with a deeper understanding of their audience's behaviors. This will provide insights into essential data such as:
- Subscribers.
- Unique viewers.
- Returning viewers.
Trends or Research Tab
This was previously referred to as the research tab. It offers insights into YouTube search trends and the kinds of content your audience is interested in across multiple platforms. You can then use the data to identify content gaps and emerging topics.
By looking at the Trending Insights, you can get a summary of what viewers are searching for, enabling you to remain ahead of the competition. You can use the trend to create content that aligns with your viewers’ interests, boosting your views.
Under this tab, you can also see the content gaps to determine the topics you can use to create more videos or Shorts. Then, you can utilize the content gap to remain relevant and attract millions of views for both short-form and long-form YouTube videos.
Revenue Tab
Suppose you are already part of the YouTube Partner Program. The Revenue Tab lets you track your earnings on YouTube. This data is available at both the video and channel level, providing you with an overview of how your monetization is going.
It will show you various data such as:
- Estimated revenue. This shows you the revenue you receive from various streams, such as super chats, memberships, and ad views. You can use the metric to determine if your monetization strategies are effective.
- Payment timelines. YouTube typically finalizes earnings between the 7th and 12th of each month. This tab provides updates on your earnings and shows when to expect your next YouTube AdSense payment.
In the following sections, we will examine the key metrics to monitor to identify growth opportunities, refine your content, and meet your audience’s expectations and preferences.
Key YouTube Metrics to Track
Now that you understand how to access YouTube Analytics, let's examine some of the key data you will find there and how to interpret it.
Watchtime
This refers to the total number of hours people have watched your videos. It's one of the most important metrics as YouTube uses it to determine how engaging your videos are. If your video has a high watch time, YouTube interprets it as a sign that the video is engaging and rewards the video and the channel in general with more recommendations on the home page and in search results.
To view the number of times the video has been watched, refer to the "Watch Time Summary." You can rank the videos according to their watch time and categorize them by length, style, and theme to get an idea of the most engaging videos. If you notice that your videos are getting a low watch time, consider using the following tips:
- Create high-quality videos with engaging content and audio.
- Use a compelling thumbnail and title.
- Create evergreen YouTube videos.
- Maintain the viewer's attention with a pattern interrupter.
- Leverage YouTube end screens and cards to keep viewers engaged on your channel.
- Use playlists to increase your watch time.
Average Percentage Viewed
This metric shows the average percentage of videos the viewers view. It indicates the video's overall ability to hold viewers' attention. When the YouTube algorithm determines that your video is grabbing people’s attention for a long time, it will rank it higher in the recommendation page and search function.
To view the metric under Watch Time, go to YouTube Studio, then select Overview, followed by Watch Time, and click "See More." After that, click Content, then Watchtime, More Metrics, Overview, and finally the Average Percentage Viewed. Use the following tips to increase your average percentage viewed:
- Make your content very compelling with some strong hooks.
- Create videos with optimal length.
- Leverage pattern interrupt.
- Direct viewers to other videos using end screens and cards.
Average View Time
This refers to the total video watch time divided by the number of video plays and replays. This is a good metric for assessing whether your videos engage viewers. Videos that aren't engaging will cause viewers to bounce off quickly, resulting in a poor average watch time. This metric can also be viewed under “Watch Time.”
You can increase your average view duration by creating compelling content that begins with a hook in the first 30 seconds. You should also use storytelling and strong videos.
To maintain the viewers’ interest, optimize the video titles and thumbnails. Then, structure your videos to hold viewers’ interest by using playlists. If you find that viewers seem to enjoy certain kinds of content, create more of such content.
Audience Retention
This metric is a good indicator of your videos' viewers' retention at a given moment. Just like the other metrics, if YouTube realizes that a particular video has a high watch time, it rewards it with a higher ranking, as it's an indicator that the video is capturing viewers' attention.
By examining audience retention data, you can determine which sections of videos are engaging and use that insight to inform your next videos. By reviewing your audience retention, you can decide which parts of the videos are boring and remove them from your current and future videos.
You can find your audience retention data by navigating to Analytics > Engagement> Audience Retention. When you are checking your audience retention data, you will realize that it consists of two graphs:
- An absolute retention curve: A metric showing the ability of the video to retain viewers.
- Relative retention curve. The ability of a video to maintain viewers compared to another video of similar length.
To increase your YouTube audience retention, consider using the following tips:
- Capture your audience in the first 15 seconds using a strong hook.
- Use pattern interrupts such as jump cuts and quick transitions.
- Provide value quickly.
- Be concise so that viewers don't lose interest.
- Create informative, engaging, and entertaining videos that hold viewers’ attention.
Re-Watches
This metric measures how many times your viewers rewatch a specific part of the video. If people keep rewatching a particular part of a video, it may indicate that it is drawing their interest. You can view the re-watch data by checking the graph labelled “Absolute audience retention.” The rewatches are usually marked by cruising curves.
Engagement
Metrics such as likes, dislikes, and shares provide substantial qualitative data. For instance, comments can reveal how your videos emotionally affect viewers. On the other hand, shares can indicate whether viewers trust your brand and content. Often, viewers share videos that align with their values. That means when they share your content, they are showing support and trust for your brand.
You can refer to the likes vs. dislikes to determine the topics that work best for a specific audience. To find the video engagement metric, check the YouTube Interaction reports by navigating to Analytics, then selecting Engagement, followed by Likes vs. Dislikes, and finally, “See More.” You can read why people may not be engaging with your content.
Impression Click-through Rate
YouTube also shows whether your videos are effective in prompting people to view them from the homepage, trending section, or recommendation page. If your video has a high impression CTR, it's an indication that it is resonating with your audience.
However, you will often notice that the impression-to-click-through rate typically rises immediately after a video release. This is frequently because the video is likely to appear on the home page of your subscribers, leading to a higher CTR. As the video reaches a demographic outside your primary audience, click-through rates will either decline or remain stable. When combined with the average view duration and the average percentage viewed, this metric can be a good indicator of whether your videos are drawing people’s interest.
Ensure you prepare viewers for what to expect in the video by including an accurate title and thumbnail that doesn't feel misleading to the point of mistrusting your brand. If your video is getting low click-throughs with high engagement, it could be a sign that it has a tiny but highly engaged audience.
Here are tips to help increase your YouTube impression click-through rate:
- Use relevant and captivating thumbnails.
- Use relevant keywords for search optimization.
- Identify trends by tracking your daily performance.
- Test a combination of different videos and thumbnails.
You can find your impression click-through rate under the Analytics>Reach.
Card Clicks
Cards are the small panels that slide in during a video and point viewers to another video, a playlist, a channel or, for channels in the YouTube Partner Program, an approved website. By examining card clicks, you can determine the actions each viewer takes while viewing your video.
This can reveal the more engaging cards in your videos, driving higher website traffic, subscriber growth, and watch time. When you analyze your card clicks, you can gain meaningful insights, such as the optimal placement, timing, and card duration.
To view your card clicks, start by going to Analytics, then select Reach, and finally select “See More.” You can then click on “Impressions” for each content, followed by additional metrics, then the card, and card clicks.
Playlist Engagement
The role of playlists is to help you make your videos more digestible, as all videos with a similar theme are categorized together. That means viewers can easily watch videos on their preferred topics and be prompted to continue watching, thereby increasing your channel’s watch time. To check the engagement on your playlist, you can analyze two key metrics in the YouTube Playlist Metrics:
- Views per playlist. This refers to the average video views for each playlist.
- Average time on playlist. It refers to the average time viewers watch the video in the playlist.
If you notice any underperformance in these metrics, place the video with the highest retention at the top. You can find the playlist engagement metric by navigating to Analytics, then selecting Engagement and clicking "See More." You should then click "More Metrics" and then "Playlists."
Unique Viewers
These refer to the estimated number of people who watch videos over a particular time. This metric can offer insight into your audience size and is a good metric for tracking your subscribers' engagement. If you have fewer unique viewers than subscribers, it indicates that your subscribers aren't watching most of your videos.
You can improve subscriber activity by reminding them to click the notifications button to be informed of your new videos. To find the metric, go to Reach views, then select the Audience tab. You can increase your YouTube unique views by:
- Creating high-quality content that offers value to viewers.
- Repurposing YouTube videos into Shorts.
- Producing a variety of content.
- Creating trending content.
Views Per Unique Viewer
This refers to the average frequency with which the viewer watches a video. If you see a high views-per-unique-viewer ratio, it means most of your viewers are rewatching your videos. If you find that a video topic has a high views per unique viewer, it means that it is also a very popular video topic for you.
By covering more of such topics, you can increase your watch time, views, and subscribers. You can find the views per unique view in Analytics, followed by Audience, then Unique Viewers. Click on See More, followed by the Average views for each viewer.
Audience Demographics
The Audience demographic report provides insight into the types of audience watching your videos, based on metrics such as gender, age, and geographic location. This can be a valuable metric for identifying the audience engaging the most, providing insight into the audience you should target more effectively.
If you are missing your target audience, consider adjusting your video strategy to better reach them. You can find these demographics in Analytics, followed by Audience, then Age & Gender.
Subscriber Growth Rate
Subscribers play a crucial role in your videos, as they are the individuals who share your values, content, and brand. These are the foundation of a successful channel, as YouTube will often recommend your content to them and may even notify them when you upload a new video, mainly resulting in more views. Statistically, subscribers also tend to watch your videos two times more than nonsubscribers, meaning that if you have a high number of subscribers, you are also likely to get a high number of views.
The subscriber growth rate shows you the video, time, and location where you gained subscribers, their locations, and the exact time period during which you gained or lost subscribers. You can use this data to get insight into the topics that resonate best with your audience. When you focus on meeting the needs of your subscribers, you can make videos that are well-received and, therefore, improve your search ranking.
Traffic Source
Traffic sources show where your viewers found your videos, such as YouTube search, the Home feed, suggested videos, playlists or external websites and apps. The report shows how most viewers discover your content, as well as the top source of watch time and views. The data is essential for a better video optimization strategy.
Keywords
When you navigate to the Traffic Source, followed by the Reach report, you will see the keywords that are driving your video traffic. At times, some queries differ slightly from your initial topic idea. In such a case, the best course of action is to update your video and add more content to fill the gaps. You can then add the keywords to your key metadata.
How to Use YouTube Analytics to Grow Your Channel
You can use the YouTube Studio Analytics to get essential insights that will help you refine your content strategy and increase engagement. Here are tips for using YouTube to improve your channel's performance:
Improve Your Video Performance
YouTube Analytics will show you your top-performing videos, allowing you to research and create similar content that your audience will love. Therefore, pay attention to metrics such as Click-through rate to optimize your titles, descriptions, and thumbnails. In return, you can enhance the video’s visibility, thereby increasing clicks. When you create content that resonates with your target audience, you can increase clicks and views.
Improve Your Audience Retention and Watch Times
Various video elements, such as subtitles and timestamps, can increase video accessibility and navigation. You can use the YouTube Studio metric to experiment with multiple video formats and lengths, such as long-form videos or shorts. You can then use the data to determine the right balance to keep your audience engaged. By maximizing your video watch time and retention, you can increase the likelihood that the YouTube algorithm will recommend your videos.
Improve Your Video Discoverability and Traffic
You can review video analytics to identify the most effective keywords to include in your descriptions, video titles, and tags, thereby enhancing your ranking. By examining and optimizing your end screens and cards, you can encourage viewers to continue watching other videos on your channel, thereby increasing overall watch time and audience engagement.
Improve Your Monetization Strategies
We noted earlier that the Revenue Tab in YouTube Analytics helps you determine how different content types contribute to your overall earnings. Therefore, you can experience a variety of topics and formats. You can also leverage analytics to determine which revenue method is generating the most revenue. You can then try different revenue streams, such as channel memberships, affiliate marketing, and sponsored shop deals.
Conclusion
Whether you are a brand or creator, you can leverage YouTube Studio to determine the kind of content that resonates with your target audience. By providing you with key data on your video and channel performance, YouTube analytics empowers you to improve your content and overall channel strategy.
By understanding the metrics outlined in this guide and applying the tips provided, you can enhance your videos and elevate your channel to the next level. You can read our guide on the best YouTube script writing tools.