
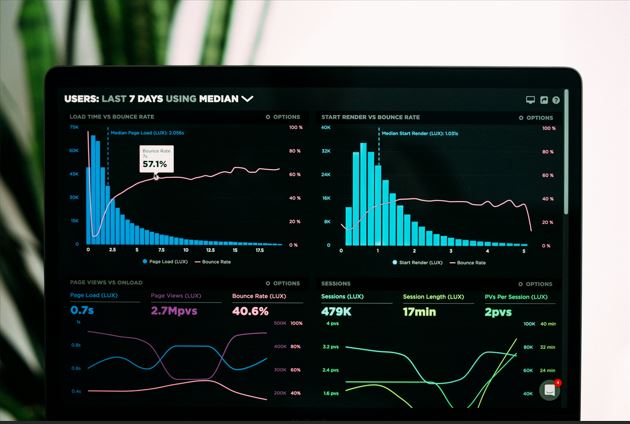
Businesses collect large volumes of data daily, including social media customer demographics, competitor data, and buying patterns. If you want to make the most of your social media data, you need to leverage data visualization.
This is the key to turning your raw data into actionable insights. In this article, we will explain why data visualization is essential for business and how to use it to gain insights from your social media data.
What is Social Media Data Visualization?
Data visualization involves transforming information and data into visual formats, such as charts, infographics, and maps. This process helps you understand the patterns and trends in your social media data. It also makes it easier for businesses to make sense of large volumes of data, turning the data into easily digestible formats. This implies that data visualization can be essential to your social media reporting efforts.
Benefits and Drawbacks of Social Media Data Visualization
Data visualization is based on the belief that humans process information in visual formats faster than raw data. That raises the need to convert complex data sets into visual formats like graphs, charts, and interactive dashboards. Through data visualizations, decision makers can easily identify trends and patterns that may previously have been missed.
That said, here are the benefits of data visualization:
Ease of Data Analysis
Data storytelling can help captivate your audience. Even without a background in data analysis, it is easier for people to analyze the data. When using data visualization tools, your brand can explore different perspectives, providing previously hidden insights to help your brand:
- Optimize its processes. This will not only streamline your operations, but you can also reduce inefficiencies.
- Improve performance. You can see the progress in your KPIs.
- Identifying trends. In a fast-paced digital market, it's essential to remain agile by recognizing the emerging trends.
Better Decision-Making
Through visualization, you can translate large datasets into actionable insights. Therefore, it lets you make the most out of social media data. You can use data visualization to:
- Identify challenges in your business operations.
- Track your progress against your goals.
When you can dynamically interact with different sets of data, you can make more objective and informed decisions.
Reduces Risks, Misunderstandings, and Confusion
When data is visualized, it becomes easier to understand, reducing the risk of misinterpretation and confusion. Risks are also reduced when you make decisions based on data rather than biases and intuitions.
Identifying Patterns and Trends
Data visualization helps identify outliers in specific data sets. This makes it possible for people using the data to identify patterns, trends, and relationships without having to analyze large volumes of data. While patterns help them notice recurring behaviors, trends show them the shift over time.
Better Storytelling
With data visualization, you can use big data for compelling storytelling. You can use colors, patterns, typography, and other elements to visualize the data story. You can also use emojis to enhance your social media marketing.
Drawbacks of Data Visualization
On the other hand, data visualization also comes with various drawbacks, such as:
- The possibility of misinterpretation. Without a proper plan for presenting the data, you may be unable to convey your message well. This may cause people to misinterpret the data and reach incorrect conclusions.
- Details and context may be overlooked. The goal of visualization is often to simplify the data. However, this may leave you with oversimplified data, as users overlook essential details and contexts.
- Bias and distortion. When left alone, data visualization leaves the data interpretation to the audience. This means that the people interpreting the data may have biases when trying to understand the data, which can result in wrong insights.
Understanding the 3Cs of Data Visualization
You need to avoid the drawbacks above to get the most out of your data visualization. To present your data clearly and accurately, ensure that you follow these 3Cs:
Clarity
You need to ensure that the data visualization conveys a clear message about the data's meaning and the value it adds to the audience. What value is the data providing to its audience? While having data with a catchy graph may be exciting to look at, if the visualizations are not clear on the information they are presenting, then they are of no use.
Consistency
One way to prevent the data from being misread and misinterpreted is to ensure consistency in the visualization. This same visual style and rules should apply across different platforms. For instance, if you use one color for one bar chart, the meaning should be consistent across different charts and graphs. If you use green to show an increase in sales, it should also be used to show an increase in negative sentiments in another chart.
Context
Data only shows you the numbers without much context, such as whether they are good or bad. For instance, your analytics may show that your Facebook ads have a click-through rate of 4.5% and you may be left wondering if this is good, average, or bad. If you want your data to be better understood, add context.
Therefore, to better understand the data, you should provide your stakeholders with a baseline for comparison. For instance, you can offer them an industry benchmark or your campaign's performance in the last quarter.
Understand the Key Data Visualization Steps
For better data visualization, follow these steps:
Understand the Purpose
Be clear on the question you want answered by the data visualization. Ensure you clearly understand the audience you want to reach and the types of data and analysis required. This will also guide you on the essential visualizations to convey the message. This is what will serve as the foundation of your visualization goals.
Understand Your Data
After determining the purpose of the data, you will need to consider the data you want to use to answer the question. This will provide you with insights into whether you were collecting the correct data or if you need to create your own data. No matter the type of data you want to make, begin with a basic visualization. Doing so will enable you to simplify the data and gain some actionable insights.
Identify the Visualization Message
Additionally, clean and analyze your data to gain valuable insights. You need to understand the meaning of the data and identify any patterns and trends you notice. Consider also the message you are trying to convey with the data, as doing so can ensure the relevance and accuracy of the data visualization.
Select the Correct Chart
Your choice of a chart will affect the effectiveness and clarity of the visualization. This is why you need to determine the correct chart to help you understand the message you are trying to convey. Your charts can illustrate data patterns while comparing different variables.

Focus on the Key Message
When you create the chart, you need to add the relevant content to ensure a clear message interpretation. Avoid adding the number layouts and instead focus on making them into actionable insights. If you have a key takeaway or message, highlight it to help people remember it.
Types of Data Visualization
When considering an exemplary data visualization chart, you can choose from different types, such as:
- Tables. This involves representing your data in columns and rows. It is an excellent option for presenting complex visualization charts.
- Charts. These consist of graphical and tabular data representation, primarily in two axes. They can include pie charts, bar charts, and Gantt charts. If you want to present categorical data, these will help you do that.
- Graphs. These visuals often represent data in curves, areas, lines, segments, or points. Examples of these data visualizations include line graphs, bullet graphs, network graphs, or scatterplots.
- Infographics. This involves combining visuals and words to represent data. It helps to include additional details and context in the data.
- Maps. This form of data visualization is represented in the form of maps, such as heat maps, geographic maps, and tree maps. It's an excellent choice for showing hierarchical relationships and data related to a specific location.
In Conclusion
If you are feeling overwhelmed by the large volume of data you collect, consider presenting it as a data visualization. This will not only make it easier to understand the data, but it will also bridge the gap between raw data and business intelligence.