
In today’s competitive landscape, making informed decisions is more critical than ever. McKinsey research found that data-driven companies were 23 times more likely to win customers and six times more likely to keep them than companies that rely on gut feeling. This suggests that leveraging data is no longer an option.
However, it can be hard to make sense of it with so many data sources and a lot of data. The good news is that you can leverage data analytics to enhance your social media strategy in 2025. This article will guide you through the process.
What is Data Analytics?
Data analytics involves inspecting, transforming, and modelling data to find useful information, draw conclusions, and make key decisions. It consists of using different tools and techniques to determine whether there are any correlations, attributes, and trends in the data set. Therefore, it is an excellent tool for better decision-making, problem-solving, finding opportunities, and enhancing efficiency.
Data analytics can be categorized into different types, such as:
- Descriptive analytics. This data analysis method analyzes previous patterns and trends. It uses previous data to make a decision. For instance, in social commerce, you can analyze the data from earlier years to see the peak shopping period.
- Diagnostic analytics builds on the descriptive approach but tries to understand why something happened. It leverages data to gain better insights into customer behavior and operational issues.
- Predictive analytics. Many approaches use machine learning and statistical models to determine future potential based on historical data. Through predictive analytics, businesses can understand customer preferences and check for trends.
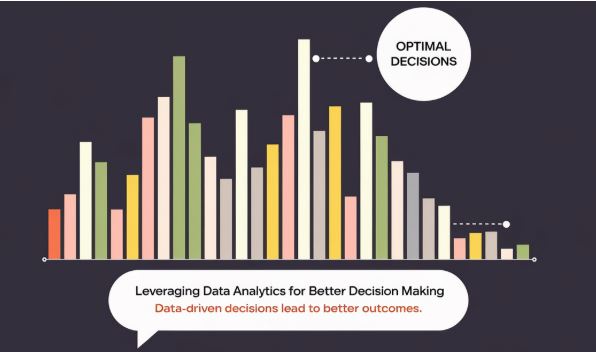
- Prescriptive analytics. This builds on the previous steps to provide recommendations based on the analysis and then suggest the optimal decisions.
Importance of a Data-Driven Culture
Data analytics can help you in several areas, such as:
Understanding Customer Behaviors
While many brands understand that customers are the lifeline of their business, many don't take the time to understand their needs, preferences, motivations, and pain points. The good news is that data analytics can unlock this data. By taking time to understand the customer’s behaviors, purchase histories, and reviewing their data, you can:
- Create more targeted marketing campaigns. By understanding your customers, you can create campaigns that resonate with them, increasing conversion and engagement.
- Create the right products for your customers. Using real data, you can understand your customers' market gaps and unmet needs and create offers that increase demand and customer satisfaction.
- Understand the customer churn rate. You can identify high-risk customers through predictive analytics and implement strategies to increase loyalty and reduce revenue loss.
We recommend you read our guide on turning boring data into compelling social media content.
Create a Culture of Using Data to Make Decisions
When different decision makers in a company are empowered with relevant data, they can make better decisions. Instead of relying on their guts, they make decisions based on data. This ensures that all strategies and hypotheses are tested and validated using data. Therefore, businesses can make more informed decisions instead of guessing.
When data is available to all employees, there can be a better sense of accountability and ownership in decision-making. You can equip your teams with the right tools to gain efficiency and growth insights.
Steps in Data Analytics
To get started with data analytics, follow these steps:
- Determine data requirements and grouping. Data can be categorized according to age, income, gender, and demographics. The data's value can be numerical or as per the category.
- Collecting data. You can get your data from different sources, such as your social media analytics, website analytics, sales records, surveys and customer service logs.
- Organize data for analysis. You can organize the data in a spreadsheet or use other statistical software to collect data.
- Data clean up. You can clean the data to remove any errors or duplications. In this step, errors are corrected before the data goes for analysis.
Data Analytics Techniques
Several data analytics techniques and methods can be used to extract and process data. Here are some of the most popular options:
Regression Analysis
This is a technique that analyses the relationship between a dependent and an independent variable. An independent cause refers to a cause changed or manipulated by a researcher, while the dependent variable measures the effects of the manipulation. Therefore, in this technique, the independent variable explains the dependent variable.
Factor Analysis
In this technique, complex data consisting of many variables is reduced to a smaller number of variables, uncovering hidden trends that would not have been easy to detect. The small variables, also known as factors, are used to show the relationship between the larger set of observed variables. All complexities are reduced as the correlated variables are categorized together, putting them into meaningful dimensions that uncover the hidden structures of the data.

Cohort Analysis
In this method, data sets are grouped into smaller groups, in most cases according to the customer’s demographics. This enables the data analysts to investigate the numbers relating to the data subset more deeply.
Monte Carlo Simulations
This is a simulation model that illustrates the possibility of different outcomes, and often helps prevent losses and risks. It adds different variables and approaches, most with greater forecasting capabilities than other data analytics approaches.
Time Series Analysis
This data analysis method tracks data over a specific period to assign weight to the relationship between the data point values and occurrences. This technique helps track cyclical trends to see financial forecasts.
In Conclusion
Data analysis can help organizations and individuals use data in the real world, where people are becoming more reliant on gathering statistics and information. You can use different tools and strategies to transform raw data and gain more educational and informative insights to improve your thoughtful management.
If you want to turn your findings into content people enjoy, read our guide on using data storytelling to captivate your audience.