
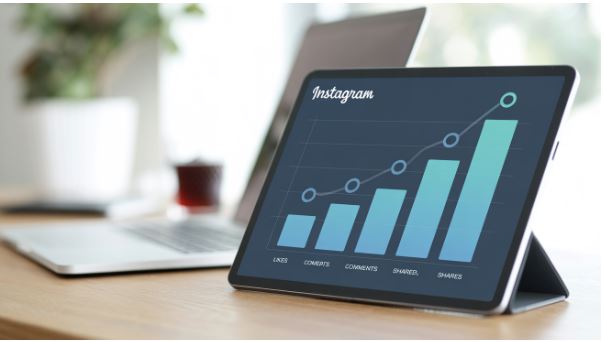
Influencer marketing can help brands connect authentically with their target audience. However, suppose your brand works with multiple influencers and on different social media platforms with various metrics. In that case, you may be overwhelmed by the data, which can lead to confusion.
To address the challenge, you can use data visualization. This strategy turns your raw data into clear and actionable insights. You can then use data storytelling to captivate your social media audience. In this article, we will examine how to use data visualization for your influencer marketing campaigns.
Importance of Data in an Influencer Marketing Campaign
Investing in an influencer marketing campaign can be expensive. Even when it seems you are working with affordable micro-influencers, it is essential to ensure that you are getting value for every dollar spent. One way to ensure a good ROI on your influencer marketing campaign is through the use of data.
Without the correct data, you could lose a lot. For instance, you may continue working with an influencer who isn't adding value to your brand. You might also continue to use outdated influencer marketing methods as your competitors leverage the latest influencer marketing trends, such as virtual influencers and AI-generated content. However, a lot of data may also overwhelm you.
The Challenge of Data Overload in Influencer Marketing
When collaborating with an influencer, you will receive vast amounts of data, such as impressions, reach, engagement rate, followers count, sentiment analysis, conversions, click-throughs, and more. What makes it even more challenging is the fact that the data may be coming from different social media platforms such as Facebook, Instagram, X (Twitter), and TikTok.
If you manually analyze this data, you might face data paralysis, making it hard to make sense of the data or get clear insight. Without these clear insights, you can easily make decisions using wrong or incomplete data, miss specific opportunities, or waste budgets. Learning how to filter the key signals from the noise in your social listening data is a good idea.
Importance of Data Visualization in Influencer Marketing
The most obvious benefit of data visualization is that it helps improve your reporting. However, it also helps with making data-driven decisions. You can encourage collaborations between teams and promote creativity through the right visuals by uncovering the challenges you would otherwise not have noticed.
Brands can, therefore, use visual stories to determine if the influencer marketing campaign is bringing the desired results, create outstanding campaigns, and successfully scale up their efforts. If you are a brand collaborating with influencers, data visualization will help you to:
- Easily identify the top-performing influencers. Visual tools allow you to analyze data and determine the influencers delivering the best results for your brand. This makes choosing your influencers easier and helps you identify the ones to continue working with.
- Grasp your audience demographic. If you can get a visual breakdown of the age, interests, location, and gender of each influencer's followers, you can focus on reaching your target audience.
- Track patterns and trends. Using data analysis tools such as heat maps and graphs, you can easily see a pattern or trend that will help you stay in control of your campaign.
Through data visualization, there is better communication between different stakeholders. This makes the decision-making process easier. It helps brands determine what is working and what isn't and make adjustments when necessary.
Key Data to Visualize in Influencer Marketing Campaigns
Visualizing the following data can help you make the most out of your influencer marketing data:
- Engagement trends. This can help you determine if there is an increase in the influencer's engagement rate. It can show if the audience’s interaction remains stable or reduces, helping assess the ongoing impact.
- Breakdown of Audience demographic. You can use data visuals such as bar and pie charts to show the composition of the followers according to their age, location, and gender. These insights can help you focus on the right audience as you match the influencer audience with the brand persona.
- Geographical reach maps. By visualizing the location of your followers, you can tailor regional campaigns.
- Sentiment analysis visuals. You can display your audience's sentiments in visuals and categorize them as positive, negative, or neutral. Use the mentions and comments to create the visuals.

How to Use Data Visualization in Influencer Marketing
When using data visualization for your influencer marketing campaigns, follow these steps:
Choose the Right Metrics
Start by identifying the KPIs of your influencer marketing campaign that align with your marketing objective. These may include metrics such as reach, impressions, click-through rate, and engagement rate. Visualizing these metrics can help you understand each influencer's impact and content.
For instance, you can organize the engagement rate in a bar chart to see which influencer is bringing the highest engagement. Similarly, a line graph can indicate your impression or reach over a specific period. When you track the right metrics, you can make data-driven decisions for an optimal campaign.
Choose from a Variety of Visuals
You can use different data visualizations for various purposes. For instance, you can use pie charts to capture the voice of the customer. On the other hand, geographic heat maps can be great for analyzing campaigns targeting certain regions. When you select the proper visualization, you can get essential insights you would otherwise not have found in a spreadsheet.
Tracking Trends
You can use time series visualizations, such as area or line charts, to track your campaign's performance over time. You can track when engagement is reaching peaks, perhaps during a product launch or a holiday season. You can then adjust your strategy accordingly. Through a consistent trend analysis, you can forecast the outcomes of future campaigns using historical data and ensure you remain one step ahead.
Comparative Analysis
To better understand what is working and what isn't over time, you can compare campaign performance across different periods. To do this, you can use a clustered column or a stacked bar chart to compare different data side by side.
Such a visual comparison will show you the influencer who will bring the highest ROI. You can focus on more effective resource allocation. Then, you can use the data to benchmark your campaign against previous ones and set realistic goals.
Combine Influencer Platforms With Data Visualization Tools
The top influencer marketing platforms, such as Heepsy, can provide essential data on influencers, including audience demographics, follower counts, and engagement levels. When you combine this data with the data visualization tools, you can have interactive reports that meet the needs of your campaign. Through such a consolidation, you can:
- Consolidate data from different sources into a single view.
- Have automated and up-to-date reports that reduce the chances of errors and save you time.
- Dynamic segmentation and filtering to get a deeper dive into the data.
- Easier communication insights with stakeholders to enable faster decision-making.
Engagement Insights
You can also use data visualization tools to delve into engagement metrics to determine the interaction quality between influencers and audiences. Rather than just counting comments or likes, you can take the visualization deeper by categorizing the comments as positive, neutral, or negative.
It is also worth adding a disclosure column to your campaign dashboard. The FTC expects creators to label paid or gifted posts clearly, for example with #ad or the platform's paid-partnership tag, and a quick yes or no per post makes missing labels easy to catch before they become a problem.
You can leverage the sentiment analysis charts to understand the public's perception of your brand and inform your collaboration strategy. Once you know the sentiments, this can guide your content creation and choice of influencers.
In Conclusion
With the wealth of data produced by influencer marketing campaigns, the key to making this data valuable lies in how it is presented and analyzed. With data visualization, you can simplify complex data, showing functional patterns and guiding users to make wise campaign decisions.